Filters available on every analytics page
- Date range: Pick a start and end date. Defaults to the last 7 days (including today).
- Compare to previous period: Toggle on/off. When on (default), charts and tables show the same-length period right before your selected dates (for example, last week vs. the week before).
- Order status: Choose which orders are counted. Defaults to Completed and Pending. You can also include Archived, Canceled, or Requires action.
- Currency: Sales and refunds use your store currency. If you have multiple regions, the first region’s currency is used automatically.
- Bars/lines show the current range and (when enabled) the previous range side by side.
- Tables list the current period, and some also include the previous period for quick deltas.
- If there is no data for a period, the card explains why instead of leaving it blank.
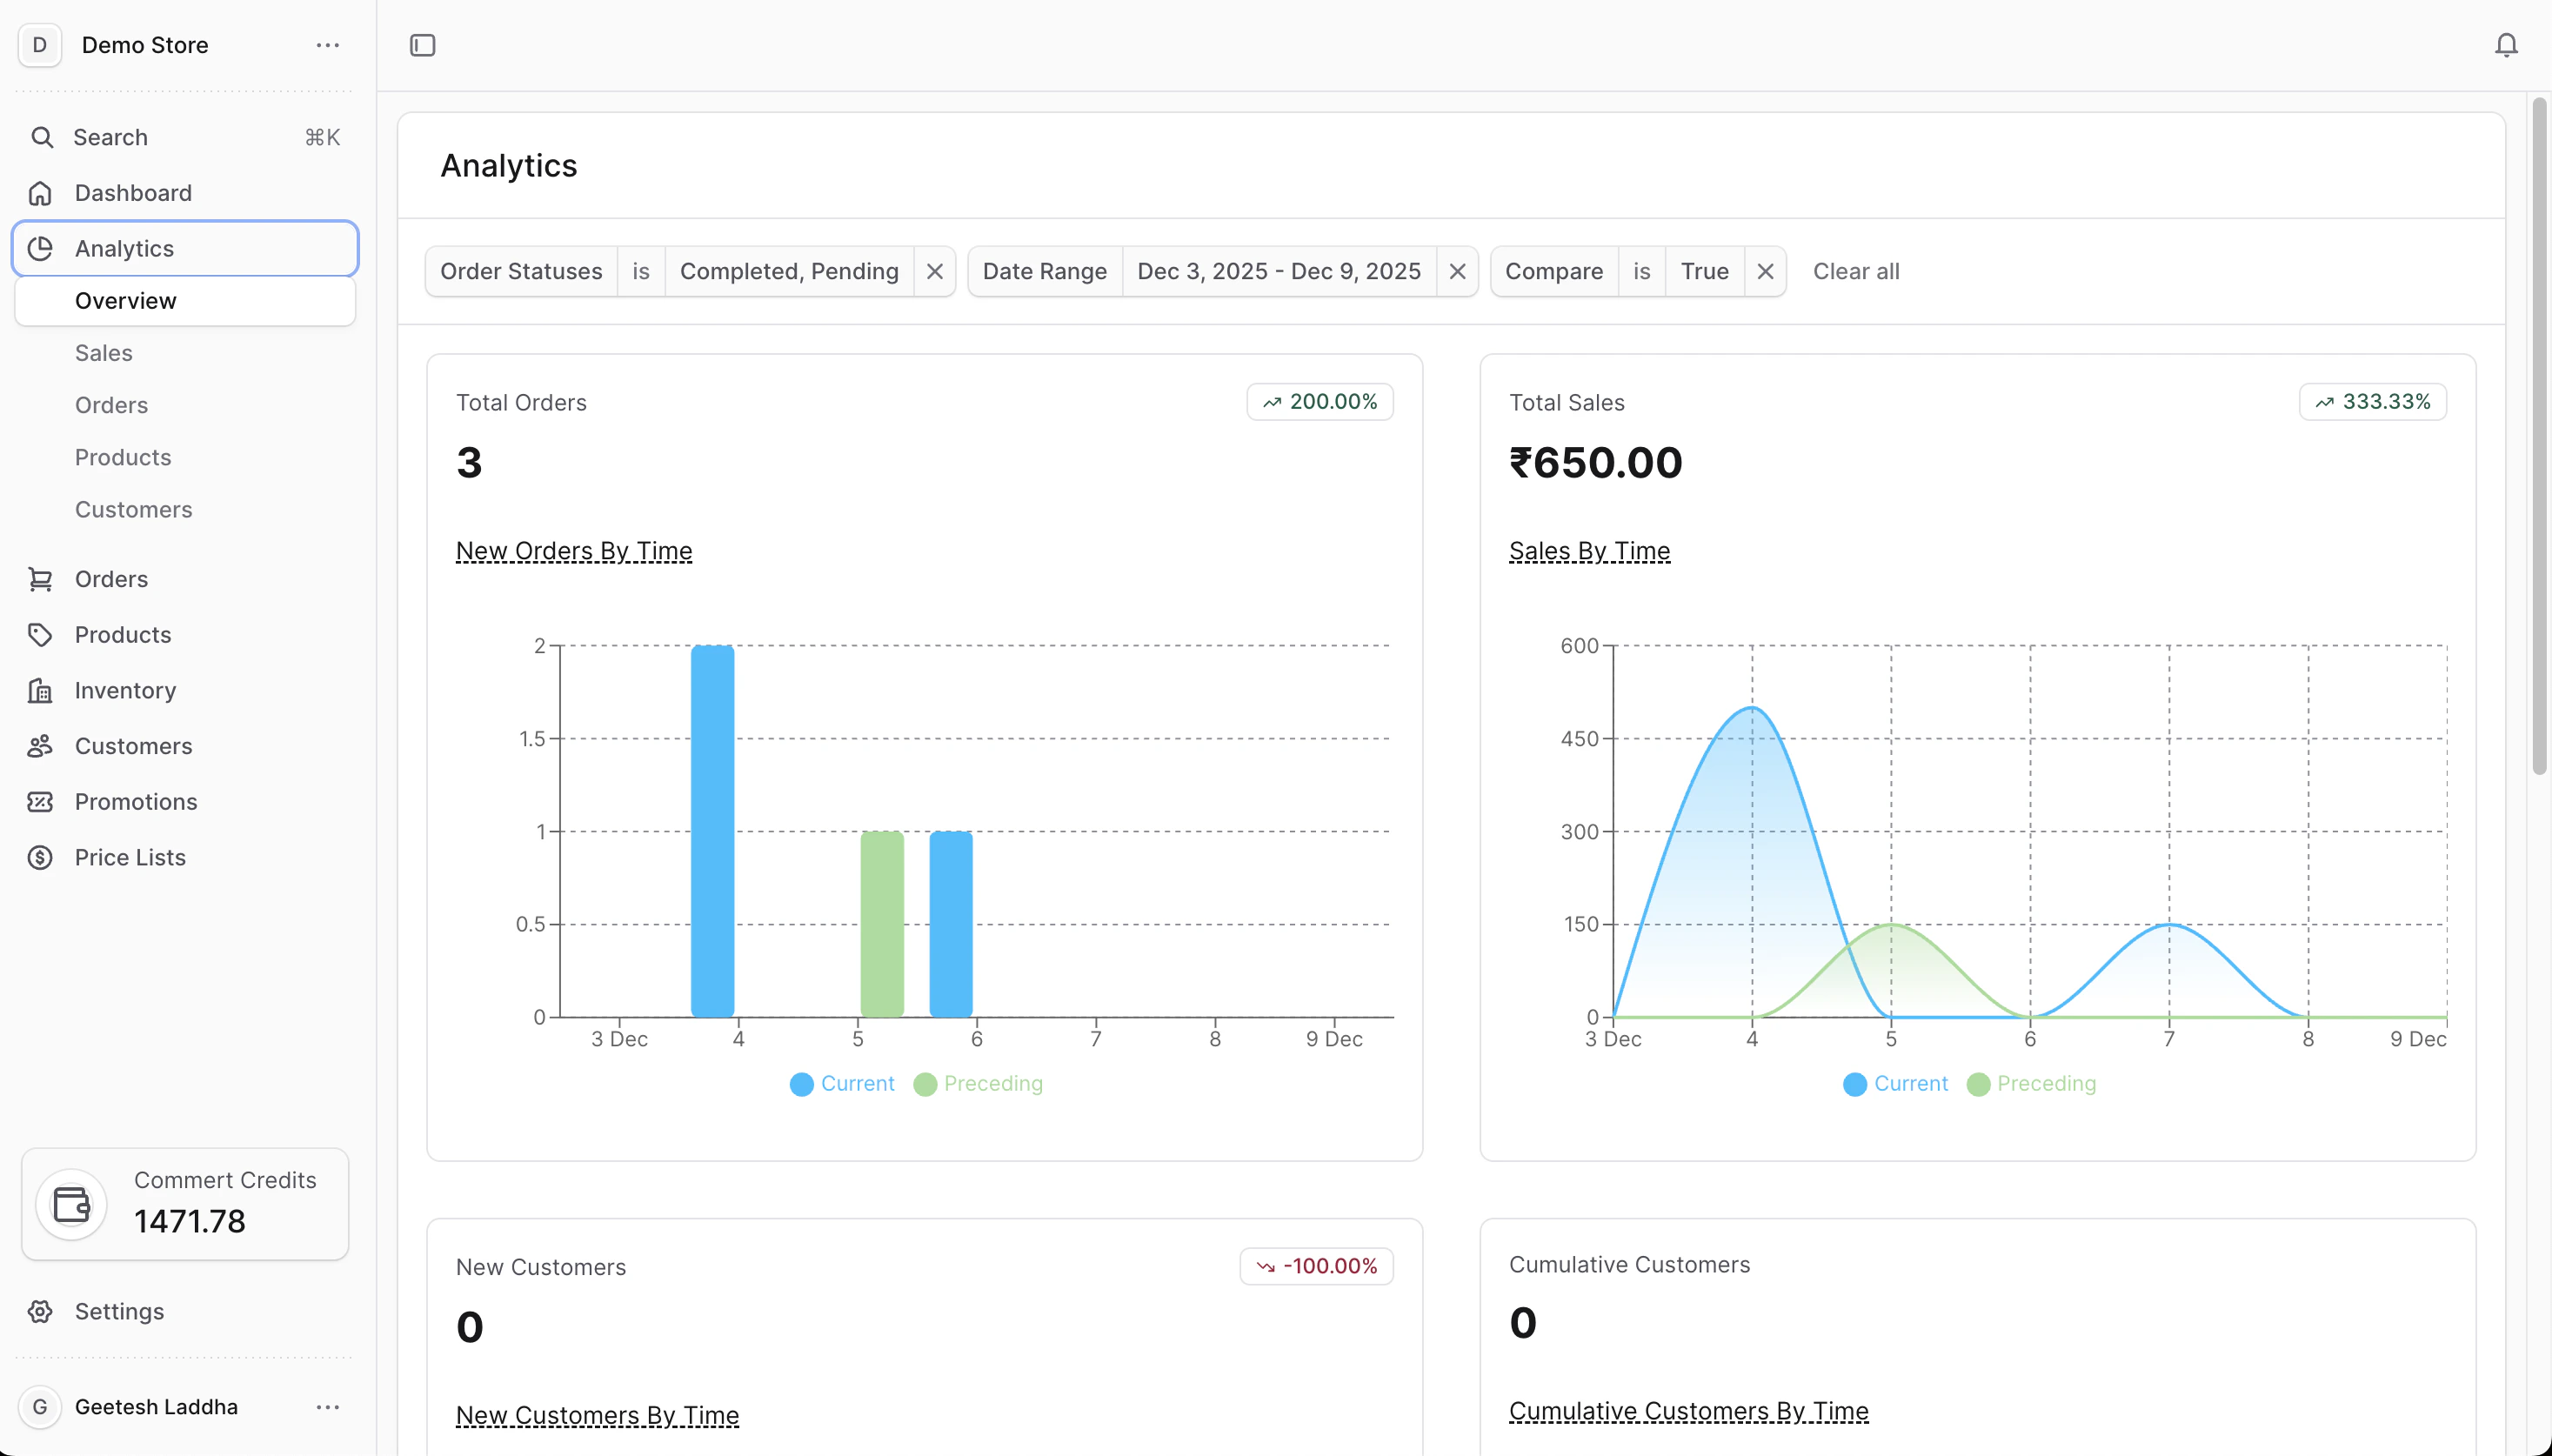
Overview dashboard
Analytics → Overview- Orders: Total orders in the selected date range plus change vs. the previous range. Respects the order status filter.
- Sales: Total sales amount in your store currency with a trend chart for the period (and comparison if enabled).
- New customers: Count of customers who placed their first order in the selected range, with a day-by-day trend.
- Cumulative customers: Running total of all customers over time so you can see growth.
- Top selling variants: Variants with the most units sold in the range. Click a row to open the product.
- Sales by channel: Which sales channels drove the most orders.
- Orders by region: Regions ranked by order volume.
- Total products sold: Total units sold in the selected range (status filter applies).
Sales analytics
Analytics → Sales- Total sales: Sales amount over time in your store currency, with comparison to the previous period.
- Sales by channel: Orders grouped by sales channel (for example, online store vs. marketplace) with current and previous counts.
- Orders by region: Regions sorted by order volume so you can spot where demand is strongest.
- Total refunds: Amount refunded in the date range with change vs. the previous period.
- Top discounts: Discount codes used most often, showing how many times each was applied.
Orders analytics
Analytics → Orders- Orders: Total orders for the range with change vs. the previous period (status filter applies).
- Payment provider share: Pie chart showing what share of orders used each payment provider, with an optional comparison to the previous period.
Products analytics
Analytics → Products- Top selling variants: Variants with the highest unit sales in the chosen range (status filter applies). Rows link to the product detail page.
- Out-of-stock variants: Up to five variants that are currently out of stock, with pagination to see more if needed.
- Top returned variants: Variants with the most returns in the selected range, helping you spot quality or fit issues.
- Total products sold: Total units sold in the date range with change vs. the previous period.
Customers analytics
Analytics → Customers- New customers: Customers who placed their first order in the selected range, plus the change vs. the previous period.
- Cumulative customers: Running total of customers so you can see overall growth over time.
- Repeat customer rate: Share of orders from repeat customers vs. one-time customers, shown as a pie chart.
- Retention rate: Percentage of customers who came back and ordered again in the selected range.
- Totals and percentages always match the date range and statuses you picked.
- When comparison is on, green upward arrows mean growth vs. the previous period; downward arrows mean decline.
- If a card says there is no data, try widening the date range or removing extra statuses.